ISA season concludes with £931 million invested in April
Thursday 07 June 2018
The Investment Association’s monthly statistics of UK investor behaviour in April 2018 show:
- A combination of positive equity markets and ISA season sales has led to a 3% increase in industry funds under management in April to £1.2 trillion.
- This ISA season, £256 million was invested into funds through ISA wrappers between 1-5 April and £675 million in the rest of the month.
- Global Emerging Markets funds attracted significant net retail inflows in April. UK investors allocated £267 million to the sector in comparison to an average monthly inflow of £52 million over the previous 12 months.
Chris Cummings, Chief Executive of the Investment Association, said:
“ISAs are a popular way to save for many UK consumers. Although ISA sales are significant throughout the year, they spike around the change in tax year. After the last minute rush at the beginning of April, savers were out in force for the new tax year. This ISA season, our data shows £256 million invested into funds through ISA wrappers during the first five days of April and £675 million in the rest of the month.”
Alastair Wainwright, Fund Market Specialist, said:
“Our ISA data shows that although ISA sales are significant throughout the year, they spike around the change in tax year (see chart below). Over the last five year period, ISAs account on average for 24% of total gross sales each month, but in April ISAs average 33% of gross sales*. In monetary terms, ISA sales average £2 billion in April each year and £1.2 billion in other months."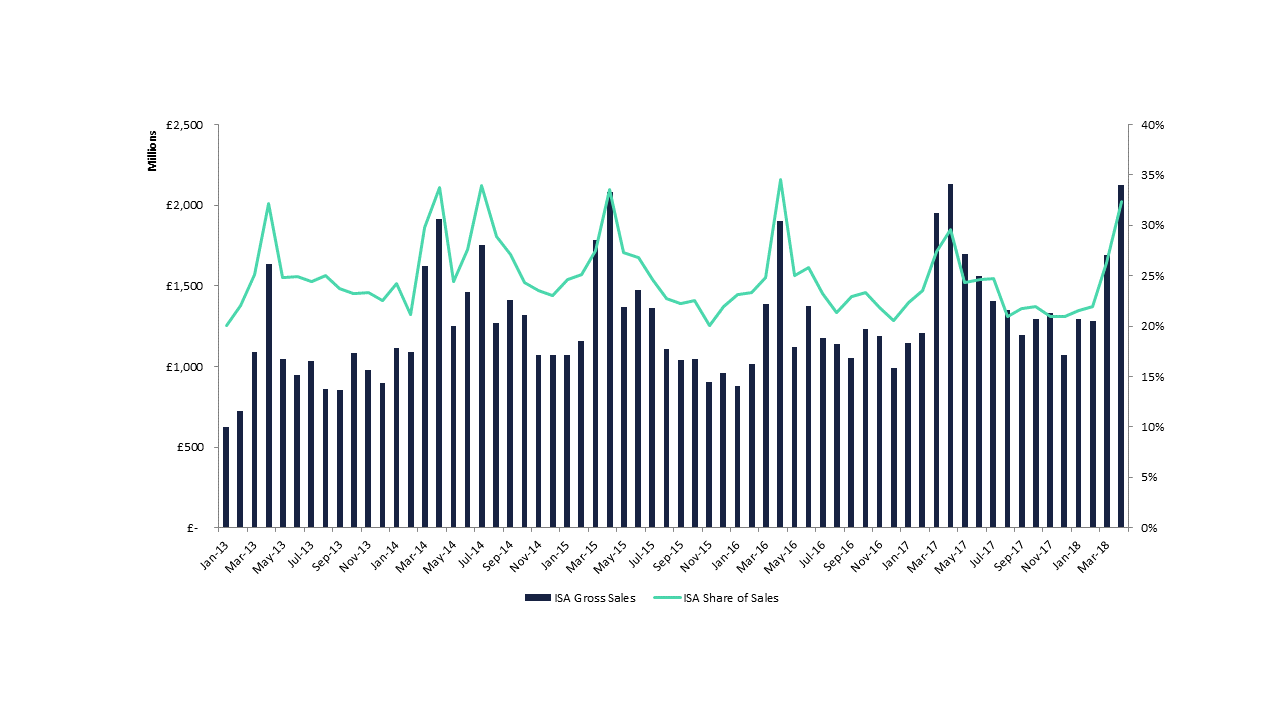
“Equity and mixed asset funds were most popular with ISA investors on the five fund platforms with around £1.2 billion of net sales in both asset classes in the 2017/18 tax year. Fund of funds were the most popular vehicle, with £3.1 billion in net sales in the 2017/18 tax year.”
“In the wider market, investors in UK equities were rewarded with good performance in April, as the FTSE 100 TR returned 6.8% and the FTSE All Share TR returned 6.4%. This was helped in no small part by an increase in the price of oil which boosted the energy sector. The sector average return for the UK Equity Income sector, according to Morningstar, was 6.3% with the best performing fund in the sector making 9.6% through April.”
“Although not the best-selling sector, it was notable that the Global Emerging Markets sector attracted significant net retail inflows in April. UK investors allocated £267 million to the sector in comparison to an average monthly inflow of £52 million over the previous 12 months.”
FUNDS UNDER MANAGEMENT AND NET SALES
| Funds Under Management | Net Retail Sales | Net Institutional Sales | |
| April 2018 | £1.2 trillion | £2.4 billion | -£8.8 billion |
| April 2017 | £1.1 trillion | £5.1 billion | £2.6 billion |
The net institutional outflow is caused by investors switching to funds not in our universe. It is not an outflow from the industry.
ASSET CLASSES
Equity was the best selling asset class with £1.6 billion in net retail sales.
Mixed Asset was the second best-selling asset class with £1.1 billion in net retail sales.
Funds classified as Other were the third best-selling asset class with net retail sales of £122 million. This includes the Targeted Absolute Return, Volatility Managed, Protected and Unclassified sectors.
Property experienced a net retail outflow of £15 million.
Fixed Income and Money Market experienced outflows of £210 million and £236 million respectively.
NET RETAIL SALES OF EQUITY FUNDS BY REGION*
Global funds were the best-selling in April with net retail sales of £855 million.
North America funds were the next best-selling with net retail sales of £461 million.
Asia funds were the third best-selling with net retail sales of £228 million.
Europe and Japan funds saw net retail inflows of £54 million and £40 million respectively.
UK funds experienced net retail outflows of £142 million.
| Region | Net retail sales in April 2018 |
Average net retail sales for previous 12 months |
| Global | £855 million | £428 million |
|
North America |
£461 million | £116 million |
| Asia | £228 million | £81 million |
| Europe | £54 million | £314 million |
| Japan | £40 million | £186 million |
| UK | -£142 million | -£361 million |
THE INVESTMENT ASSOCIATION SECTOR RANKINGS
The five best-selling Investment Association sectors for April 2018 were:
- Global was the best-selling sector with net retail sales of £586 million.
- North America with net retail sales of £446 million.
- Mixed Investment 40-85% Shares with net retail sales of £346 million.
- Global Emerging Markets with net retail sales of £267 million.
- Mixed Investment 20-60% Shares with net retail sales of £227 million.
The worst-selling Investment Association sector in April 2018 was £ Corporate Bond with an outflow of £328 million.
| Investment Association Sector | Ranking in April 2018 | Net Retail Sales in April 2018 |
Ranking in March 2018 |
Net Retail Sales in March 2018 |
Asset Class |
| Global | 1 | £586 million | 1 | £462 million | Equity |
| North America | 2 | £446 million | 7 | £186 million | Equity |
|
Mixed Investment 40-85% Shares |
3 | £346 million | 2 | £336 million | Mixed Asset |
| Global Emerging Markets | 4 | £267 million | 30 | -£40 million | Equity |
|
Mixed Investment 20-60% Shares |
5 | £227 million | 3 | £251 million | Mixed Asset |
RETAIL DISTRIBUTION
In April, gross retail sales for UK fund platforms totalled £9.7 billion, representing a market share of 40.6% (48.9% in April 2017).
Other Intermediaries including UK IFAs and Wealth Managers made gross retail sales of £7.3 billion, representing a market share of 30.8% (24.6% in April 2017).
Direct gross retail sales in April were £2.1 billion, representing a market share of 8.8% (8.5% in April 2017).
FUND PLATFORM PRODUCT SALES
The five fund platforms that provide data to The Investment Association (Cofunds, Fidelity, Hargreaves Lansdown, Old Mutual Wealth and Transact) saw net retail sales of £2.6 billion in April.
ISAs had net sales of £1 billion, Personal Pensions £875 million, Unwrapped £698, while Insurance Bonds saw a net outflow of £2 million.
For the same five fund platforms, funds under management as at the end of April 2018 were £260 billion, compared with £241 billion a year earlier.
ISAs**
In April 2018, funds in ISAs provided by fund companies and the five fund platforms that feed data to The Investment Association (Cofunds, Fidelity, Hargreaves Lansdown, Old Mutual Wealth and Transact) saw a net retail inflow of £363 million.
The three best-selling sectors for ISAs based on the five fund platforms were:
- Global (186.5 million net sales)
- Mixed Investment 40-85% Shares (£92.6 million net sales)
- UK Equity Income (£82.6 million net sales)
FUND OF FUNDS
Funds of funds had a net retail inflow of £789 million in April.
Funds of funds that invested externally saw net retail sales of £432 million, while funds that invested internally saw net retail sales of £357 million.
Funds under management for funds of funds were £149 billion at the end of April 2018, accounting for 12.3% of industry funds under management, compared with 12.3% in April 2017.
TRACKER FUNDS
Tracker funds saw a net retail inflow of £522 million. Tracker funds under management stood at £168 billion as at the end of April 2018. Their overall share of industry funds under management was 13.9%, compared with 13.7% in April 2017.
ETHICAL FUNDS
Ethical funds experienced net retail inflows of £110 million in April 2018. Funds under management were £15.8 billion at the end of April, representing a 1.3% share of industry funds under management.
-ENDS-
For further information, please contact:
Anisha Patel, Head of Communications: [email protected]
T +44 (0)20 7269 4635
Helen Ayres, Media Relations Manager: [email protected]
T +44 (0)20 7269 4696, M +44 7508 724066
Notes for Editors
* Based on monthly ISA sales through the five fund platforms that provide us with data - Cofunds, Fidelity, Hargreaves Lansdown, Old Mutual Wealth and Transact.
To see a breakdown of the data referenced in this press release, please see all of the tables here.
The Investment Association's figures for fund sales cover retail and institutional sales in authorised unit trusts and open ended investment companies (OEICs) provided by our membership to UK investors. The figures do not include investment trusts and ETFs.
Each month small revisions to figures may have been made since the previous press release. This reflects additional information received by The Investment Association.
Net retail sales comprise total retail sales minus repurchases (including switches between funds), thus the figures can result in a negative figure or outflow.
* Regional breakdown for equity funds
The following Investment Association sectors have been grouped together to compile the figures for regional equity sales:
| Asia | Europe | Global | Japan | North America | UK |
| Asia Pacific excl. Japan | Europe Excl. UK | Global | Japan | North America | UK All Companies |
| Asia Pacific incl. Japan | Europe Incl. UK | Global Emerging Markets | Japanese Smaller Companies | North America Smaller Companies | UK Equity Income |
| China/Greater China | Europe Smaller Companies | Global Equity Income | UK Smaller Companies | ||
| Specialist | |||||
| Technology and Telecommunications |
Direct Channels
Direct includes sales forces and tied agents, private clients and other direct to investor sales without intermediation.
** The Investment Association’s ISA figures are based on information collected from fund companies and five fund platforms (Cofunds, Fidelity, Hargreaves Lansdown, Old Mutual Wealth and Transact) where they are the ISA provider. Fund business through other ISA providers such as wealth managers is not included. The Investment Association’s figures cover about three-quarters of the whole of the market for funds held in ISAs.
About the Investment Association:
The IA champions UK asset management, supporting British savers, investors and businesses. Our 240 members manage £6.9 trillion of assets and employ 93,500 people across the UK.
Our mission is to make investment better. Better for clients, so they achieve their financial goals. Better for companies, so they get the capital they need to grow. And better for the economy, so everyone prospers.
Our purpose is to ensure investment managers are in the best possible position to:
- Build people’s resilience to financial adversity
- Help people achieve their financial aspirations
- Enable people to maintain a decent standard of living as they grow older
- Contribute to economic growth through the efficient allocation of capital.
The money our members manage is in a wide variety of investment vehicles including authorised investment funds, pension funds and stocks and shares ISAs.
The UK is the second largest investment management centre in the world, after the US and manages 37% of all assets managed in Europe.
For further information, please contact:
For media, to receive the full consultation document, please contact Helen Ayres
Helen Ayres, Communications Manager: [email protected]
T +44 (0)20 7269 4620; M +44 (0)7508 724 066
IA press office: [email protected]
About the Investment Association (IA):
- The IA champions UK asset management, supporting British savers, investors and businesses. Our 250 members manage £7.7 trillion of assets and the asset management industry supports 100,000 jobs across the UK.
- Our mission is to make investment better. Better for clients, so they achieve their financial goals. Better for companies, so they get the capital they need to grow. And better for the economy, so everyone prospers.
- Our purpose is to ensure investment managers are in the best possible position to:
- Build people’s resilience to financial adversity
- Help people achieve their financial aspirations
- Enable people to maintain a decent standard of living as they grow older
- Contribute to economic growth through the efficient allocation of capital.
- The money our members manage is in a wide variety of investment vehicles including authorised investment funds, pension funds and stocks and shares ISAs.
- The UK is the second largest investment management centre in the world, after the US and manages 35% of all assets managed in Europe.